80%

Seamless collaboration and effective task management.

10K+

Remote teams across industries rely on our platform for seamless collaboration.

98%

Users rate us highly for our platform’s ease of use and workflow impact.

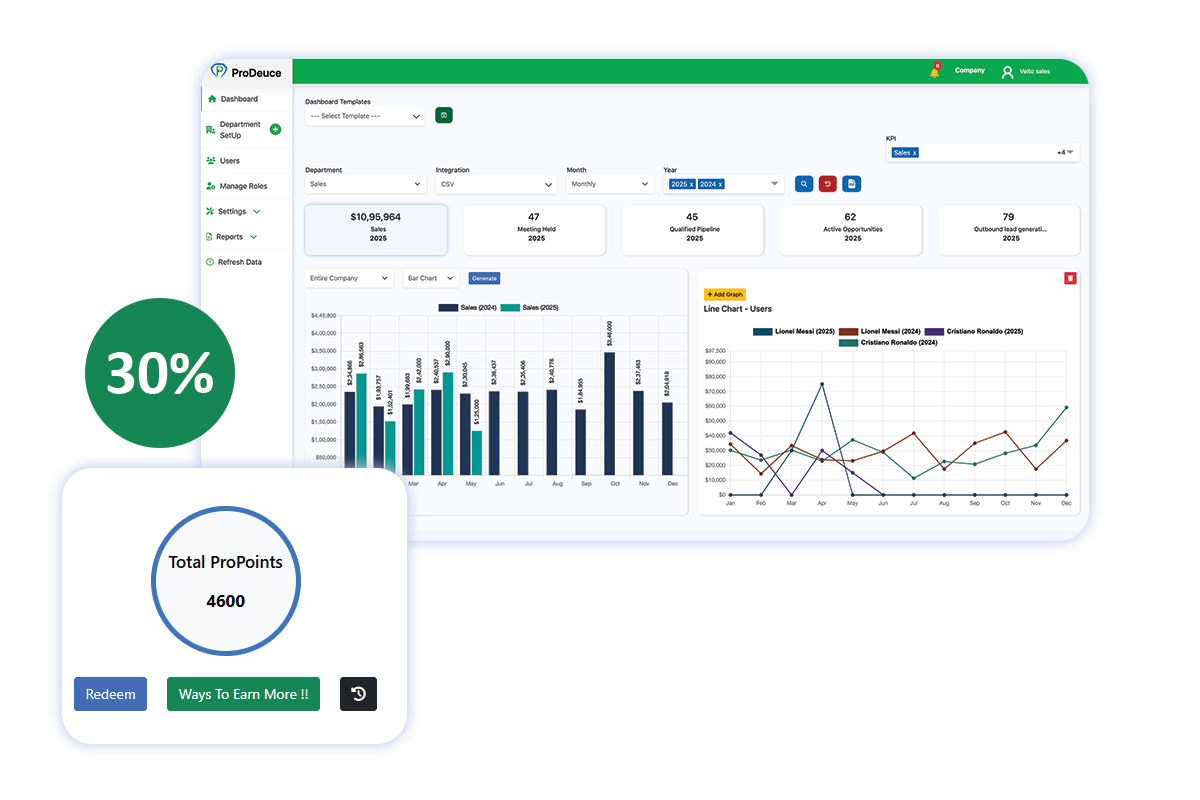
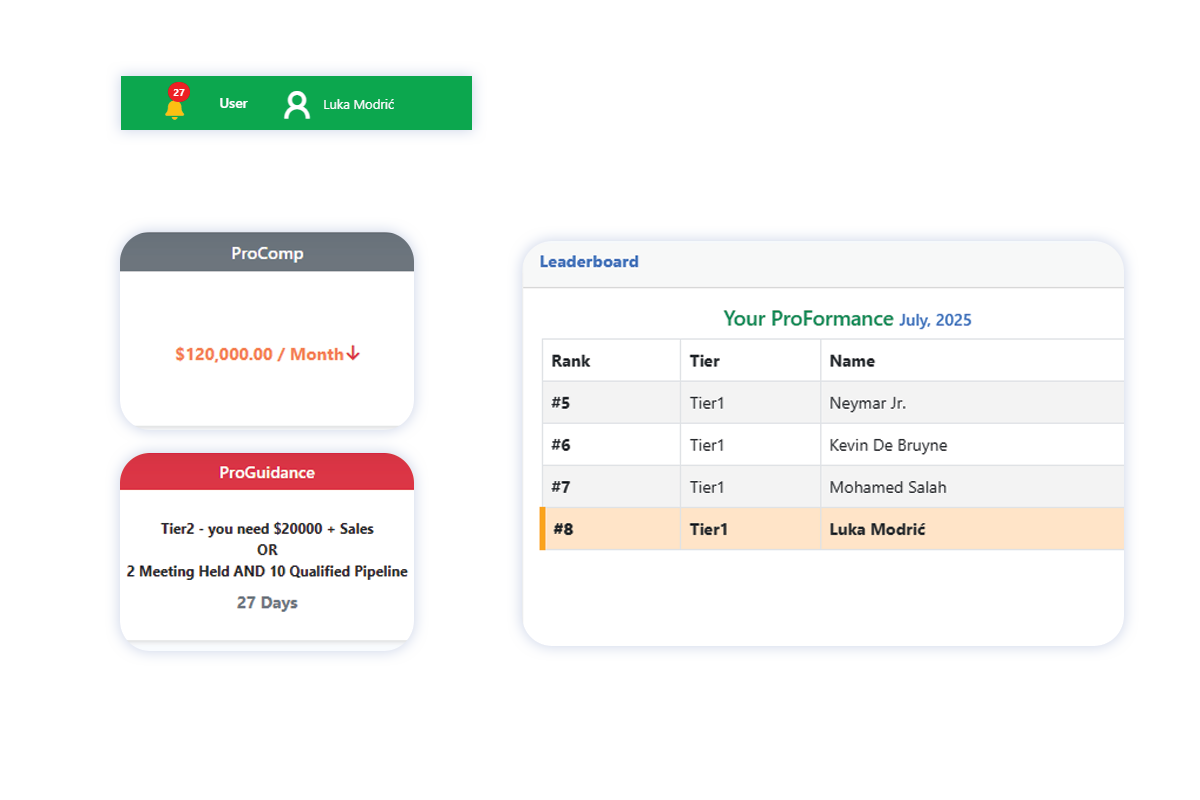
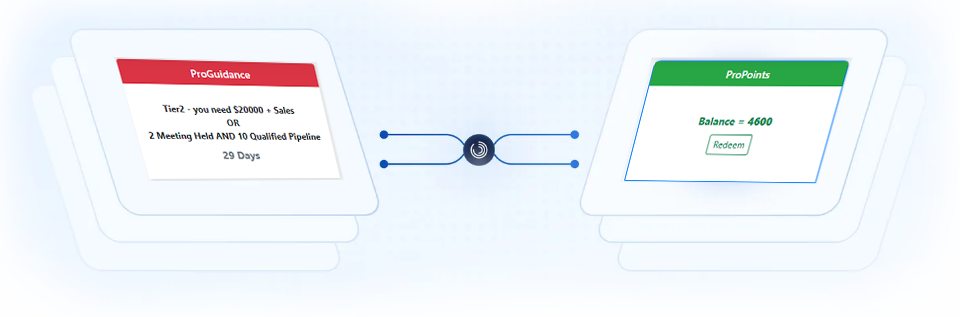
Powerful KPI Dashboards to Drive Performance

Visualize your key performance indicators in real time with our dynamic KPI dashboards. From marketing and sales metrics to finance and operations, our dashboards consolidate your most critical data into intuitive, easy-to-read views. Empower your teams with actionable insights that support faster, smarter business decisions.

KPI Dashboard Overview

Custom Dashboards for Every Business Function

Tailor dashboards to match your unique goals—track sales targets, measure campaign effectiveness, monitor customer engagement, or oversee financial performance. Our KPI dashboard solution offers flexible integrations and custom widgets that adapt to any industry or role, helping you stay aligned and proactive.

Custom KPI Dashboards

How It Works

1

Start at Tier 1

Begin your journey with basic goals.

2

Hit Your Targets

Complete meetings and hit sales goals.

3

Unlock Tiers

Reach higher levels and gain rewards.

4

Track Progress

View dashboards and leaderboards.

Built for Every Team

Solutions for your KPI tracking

Explore how ProDeuce helps teams of all sizes set, track, and achieve performance goals. From real-time dashboards to intelligent tiering systems, discover powerful tools designed to maximize your KPIs.

Start tracking smarter — no more manual work, just results.

Frequently Asked
Questions

Still need help? Chat to us

KPI software measures business performance across organizational areas such as marketing, sales, operations, and finance. It allows for consolidating data from diverse sources and visualizing this information on KPI Dashboards and Reports. This software provides businesses with analytics tools to gain insights into their performance and to make data-driven decisions.

A KPI dashboard presents key performance indicators using interactive charts and graphs, streamlining the review and analysis process. These dashboards serve as an effective tool to disseminate performance data and insights throughout an organization, promoting efficiency and informed decision-making.

A KPI report serves as a valuable performance reporting tool for businesses. It enables a quick and comprehensive review and analysis of Key Performance Indicators (KPIs). These reports provide real-time insights in a logical and easily understandable format, allowing organizations to effectively track their performance against specific goals.

KPI Analysis involves analyzing the underlying data and metrics used to create Key Performance Indicators (KPIs). This helps businesses identify opportunities, address issues, and gain insights through visual representations like graphs and charts. Data analysts and senior managers use analytics to extract insights, streamline processes, and uncover growth opportunities.

Get started with your KPI Software

Get started for free